This chapter, in accordance with the first objective of the research, explores the readiness and requirements of users of a municipal 3D GIS. Investigating user requirements for 3D GIS is a broad issue, which definitely cannot be clarified in a single study. The chapter studies the most important real objects and their mutual interrelations, which help in determining the persistent data in the GIS model proposed in Chapter 5. The study is expected to provide valuable information about the required types of objects, necessary spatial relationships and the spatial resolution acceptable for most of the users. The demand for 3D visualisation is investigated to an extent relevant to the thesis, i.e. components of the scene (see Chapter 2), which will effect the GIS model. In this respect, the study focuses on needs for realistic (shaded or textured) 3D models. The investigations into necessary interaction and manipulation will gain knowledge about the desired user interface and, hence, it is in favour of the system architecture proposed in Chapter 4.
The gathering and analysis of user requirements is a sophisticated
process demanding careful consideration of many factors. A simple questionnaire
given to the personnel responsible for a certain information system could
create a very subjective view. In contrast, by ignoring conversations with
the staff, an important observation gained from long-term experience could
be overlooked. To facilitate investigation, a particular strategy is followed.
Methods to determine user requirements are studied to select the most appropriate
way of identifying items of interest and sorting out their characteristics.
Then existing urban projects resulted in 3D CAD or VRML models are reviewed
in order to gain information about objects of interest and resolution.
The information kept presently in a municipality is studied to outline
existing and potential users, and their interests in terms of type of information
and outcomes. Last, a supplementary investigation on currently maintained
data, spatial analysis and preferences for 3D visualisation, among producers
is conducted. An analysis of the CAD projects, the municipal information
and the results of the interview motivate the selection of basic objects
of interest, resolution, spatial relationships and GUI for visualisation
and interaction that are relevant for the thesis.
3.2.1 Inventory of real objects3.3 GUI, interaction and operations
3.2.2 Geometric resolution
3.2.3 Spatial relationships
3.2.4 Realism
Plenty of methods regarding requirement determination are discussed in the literature (see Coad and Yourdon 1991, Gause and Weiberg 1989, Kozar 1989, Norman 1996). Most of them are business-oriented and related to overall analysis of processes in the organisation (company, firm, agency), starting from the mission and ending with the final outcome. All the five components of a GIS, i.e. hardware, software, people, data and procedures (see Maguire et al 1991) are considered and estimated. In this respect, the scope of this study is limited to only data and procedures (operations). Among them all, two frameworks are relevant for our goals, Performance, Information, Economy, Control, Efficiency, Services (see Wetherbe 1984) and Object-oriented requirements determination (see Coad and Yourdon 1991). The first approach refers to the production process, the second approach addresses analysis of items of interest and their interrelations.
Performance, Information, Economy, Control, Efficiency, Services (PIECES): The framework emphasises important questions that become part of a consequent discussion on a requirement's determination. Performance concerns the information system needs in order to "work" for the user, e.g. needed response time, printing quality, needs for a GUI. Information focuses on the data that the system has to maintain, e.g. input information, output information, the layout of the output, required standard screens. Economy addresses the project development, the operational cost and eventual benefits and savings, e.g. appropriate workable solutions, anticipated cost savings, "how the manual activities will be affected by an automated solution". Control is associated with the security and editing of data, e.g. at what level (user, screen, database, field, etc.) the security and editing are demanded. Efficiency is measured at three levels, i.e. organisational, departmental and individual, e.g. "what value is added to the process", "how the operations will improve the work in the office". Services focus on issues related to functional requirements, system maintenance and staff training, e.g. required operations, required training courses. The framework embraces six important aspects of an actual production process and it is highly recommended to gather requirements to upgrade existing information systems (see Norman 1996).
The PIECES framework does not offer a strategy for resolving data organisation (objects, attributes, relationships). The actual work within the framework starts with a stage where knowledge about similar processes and solutions is required. Moreover, the method is highly related to real effects (in terms of money) if a given solution is implemented. Although improvements in 3D data maintenance and low-cost solutions are intended, benefit/cost effectiveness is not a major objective of the research. The principles of the framework, however, are critical for the organisation of data in the GIS model (see Chapter 5) and the system architecture (see Chapter 4). For example, the response time of data traversal to create a VRML document (performance) is closely related to the type and structuring of geometric objects (see Chapter 8). The remote deleting of an object (control) may be restricted by a specific behaviour hosted in the database (see Chapter 5). Hence, the framework is to be used for gathering supplementary information on how the data has to be organised.
Object-oriented frameworks follow quite different approaches, i.e. the items of interest are the prime focus. Essential advantages of object-oriented frameworks, which contribute to the goal of the research, are the high emphasis on the information, the ability to concentrate on separate components of the system development (e.g. data organisation, data management, data interaction) and the ability to identify objects and clarify their characteristics in a very broad sense.
Coad's object-oriented requirements determination: Coads object-oriented framework concentrates on three issues, i.e. objects, responsibilities and scenarios. The scope of objects is in practice unlimited: an object can be a physical item, process, action, etc. Responsibilities focus on broad sense characteristics by asking three basic questions. The first question, i.e. what does the object knows about itself, tries to collect "personal" properties of the object. The second question, i.e. who does the object know pursues the clarification of relationships. The third question, i.e. what does the object do comprises objects functions or behaviours. Scenario refers to the time-ordered sequence of object interactions or changes in object. In the GIS context, the three questions of responsibilities can be interpreted as questions to investigate attributes, relationships and behaviour. Scenario then can be associated with the time component of GIS. Hence, the framework covers the scope of the GIS content, i.e. it clarifies what data has to be in the database.
Although the framework is a successful guide in the information exploration, it pays little attention to implementation issues as they are discussed in PIECES. Therefore, the two frameworks should be combined to explore what is to be included in the GIS model and how to organise it. The first two objectives (i.e. objects and responsibilities) of Coads framework provide a technique to identify real objects, regardless of the nature of the object. The performance (e.g. preferable GUI, demanded realism, data exploration and editing), information (e.g. output information, mostly updated elements) and control (e.g. data protection) are to be employed for visualisation and interaction issues.
The following step is a decision on methods to collect user requirements that reflects the validity and objectivity of the results. Clearly, different groups of people, or documents, or other evidence used, create different pictures and may outline contradictory requirements. Therefore, the level of subjectivity accepted has to be clarified a priori. Norman 1996 classified the methods of collecting user requirements, with respect to the viewpoint (perspective) they create, into three major groups:
Global perspective: The methods evaluate mostly the experience with existing systems, as the intention is to eliminate the human factor. Such methods are based on: 1) reviews of current reports, 2) conducting of survey on activities already completed by the company, 3) visiting similar system installations. The advantage of these methods is the ability to become familiar with current, established requirements. The main drawback is the concentration on already solved problems, which might be insufficient for future developments.
Individual perspective: The methods aim to reflect and challenge the experience of the user. Interviews, observations, questionnaires, prototypes can be created for the purpose. Although highly subjective, the methods provide useful information on user interfaces, operations and outcomes, which can barely be collected otherwise.
Group perspective: The methods of this group, group brainstorming, electronic joint application development, etc., utilise advanced decision-making techniques. Besides some specific differences, the common characteristic is the group discussion on the problem (i.e. user requirements). Advantages can be seen in easily identifying the conflicts among users, the ability to observe reactions to some solutions, etc. The main disadvantage is related to selecting the right people for the group.
In this research, the methods of exploring requirements belong mostly to the first two groups, i.e. global and individual perspective. Since the studied area is rather new, experience regarding similar solutions can hardly be investigated. However, a study on existing 2D and 3D information maintained in municipalities and related institutions delineates the scope of the data currently available. Thus the methods from the first group (revision of existing systems) can still be of help. Supplementary interviews and questionnaires yet within companies that deal with 3D spatial data may reveal essential needs not recognised on municipality level.
In summary, the exploration of user requirements is organised under Coads object-oriented and PIECES frameworks on the basis of global and individual methods for gathering requirements. The consortium report on a project on a 2D GIS implementation plan (Croswell et al 1994) is used to create a global viewpoint about the current status in a municipality in Bulgaria. A questionnaire on 3D (see Appendix 1) was prepared and distributed among 15 companies (in Bulgaria) with the intention of evaluating individual angles. The companies form a representative sample of producers selected with respect to 1) the dimensionality of the maintained data (at least 2,5D) and 2) the application orientation (urban or mixed). In addition, similar investigations concerning 3D models supplied valuable information about world wide tendencies. The investigation results will be discussed in the following sections (see also Zlatanova and Bandrova 1998).
3.2 Real objects of interest in urban areas
Since the chapter discusses user requirements, the groups of users will first be clarified. Here, a user means a GIS user. A particular GIS system can be utilised to collect, maintain, analyse and produce data. However, some of the system users may be responsible only for data collection, others for data storage and analysis. To distinguish between all the users, we will introduce the following terminology: information centre, producer, consumer and end user.
| GIS users | Data
Acquisition |
Maintenance | Query
and analysis |
Production | Usage |
| Information centre | - | y | y | y | - |
| Producer | y | y | y | y | - |
| Consumer | - | y | y | y | y |
| End users | - | - | y | y | y |
3.2.1 Inventory of real objects
3D real objects of interest for urban applications are often specified in the literature as the scope varying with respect to the application. The common understanding is that the most important real objects in urban areas are buildings (Grün and Dan 1997, Kofler and Gruber 1997, Tempfli 1998b). The CAD 3D models of urban areas (called city models) created so far basically consider buildings and terrain represented as TIN (Leberl and Gruber 1996). Fuch 1996 presents a study on real objects of interest for 3D city models, based on questionnaires sent to 55 participants from Europe. The interest in five groups of real objects is investigated: buildings, vegetation, traffic network, public utilities and telecommunications. The results have clearly shown the prevalent usage of (need for) buildings, traffic network and vegetation. Razinger et al 1995 present a virtual model of a square in Graz (created upon municipal request), containing buildings, traffic network (streets and tram railways) lamp-posts and trees. Dahany 1997 suggests three groups of objects to be considered: terrain, vegetation and built form.
In general, most of the authors address real objects with spatial extent. Operational data needed for urban planning in 2D, however, sometimes goes far beyond the real objects of interest discussed so far. Investigation of the organisational and information structure of a municipality (in Bulgaria) has revealed the following specifics: 1) plenty of spatial and non-spatial items stored under different descriptions (DBMS, GIS and CAD) and 2) complex interrelations among different types of data and institutions (see Table 3-2). For example, personal data are stored in several information centres: three municipal offices and the regional tax office. Is a person an object of interest? How to specify relationships with other objects? The information needed to reconstruct a number of buildings is hosted in four institutions: the municipality departments, the Electricity company, the Telecommunication company and the Water and Sewerage Corporation. Each of the companies has its own structuring and coding of data, e.g. deed is an object according to the Department of State and Municipal Properties, while it is an attribute in the Municipal Land Commission. Is the deed an object of interest or an attribute of the parcel? The Department of Architecture maintains plans for urban development, which are extremely important for any new planned construction activity. How should the plans or information inside be referred to: as objects or as the future status of existing objects? A detailed description of the records can be found in Croswell et al 1994.
The following sections present a grouping of real objects that allows the items of municipal interest discussed above to be sorted.
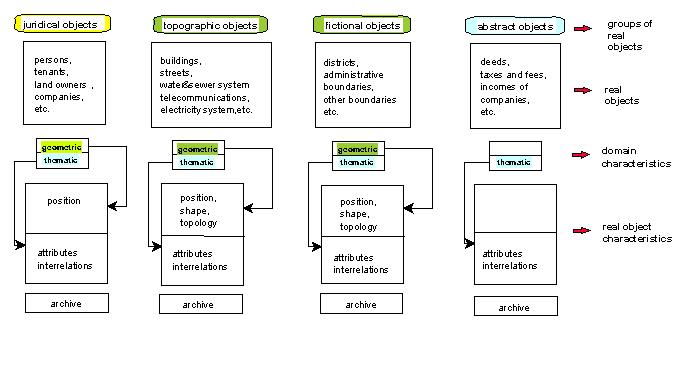
Geometric characteristics of real objects are the leading criterion of the grouping. There are objects with either 1) a complete geometric description, i.e. position, shape and/or size, or 2) only position, or 3) without geometric characteristics. In this respect, we introduce four basic groups of objects to be considered for municipal administration: juridical objects (e.g. people, institutions, companies), topographic objects (e.g. buildings, streets, utilities), fictional objects (e.g. boundaries) and abstract objects (e.g. incomes, taxes, deeds) (see Figure 3-1).
Table 3-2: Data distribution, information and users in a municipality
| Information centres | Information | Type | Users | |
|
1.
|
Municipal Offices and Departments: | |||
|
1.1
|
Department of Administration and Information Services | Civil status (ID numbers, personal data, address) | Text | Municipality, police, insurance companies, citizens |
|
1.2
|
Municipal Land Commission | Agricultural land owners (PIN of the owner, parcel IS, area location, address of the owner, deed, etc.) | Text and graphics | Municipality, companies, citizens |
|
1.3
|
Department of Social Services | Municipal tenants (name, PIN, address of the property, rent, etc.) | Text | Municipality, regional tax office |
|
1.4
|
Department of State and Municipal Properties | State and municipal property (deeds, owner, address, neighbours, price, etc.) | Text | Municipality, regional tax office, the court, cadastral offices, companies, citizens |
|
1.5
|
Transport and Traffic Safety | Streets and traffic equipment | Text and graphics | Municipality, police |
|
1.6
|
Regional Cadastre and Survey Office | Buildings, streets, DTM, geodetic network, boundaries | Text and graphics | Municipality, companies, citizens |
|
1.7
|
Regional Land and Land Use Office | Land (parcel ID, type, owner, way-of-right, etc.) | Text and graphics | Municipality, companies, citizens |
|
1.8
|
Department of Architecture and Construction | Construction, regulation, urban plans | Text and graphics | Municipality, companies, citizens |
|
2.
|
Water and Sewerage Corporation | Water and sewer network (length, radius, material, type of pipe lines, statistics about damages) | Text and graphics | Municipality, Water &sewerage Co. |
|
3.
|
Electricity Company | Electricity network | Text and graphics | Municipality, Electricity Company |
|
4.
|
Telecommunication Company | Telecommunication network | Text and graphics | Municipality, Telecommunication Company |
|
5.
|
Regional Tax Office | Regional tax register, local taxes and fees, incomes from companies (tax no. of the company, PIN of the payer, name, address, certificate, duties, building tax, etc.) | Text | Municipality, regional tax office, Ministry of Finance, citizens |
|
6.
|
State Archive | Documents | Text | Municipality, regional tax office |
|
7.
|
Information Services Ltd. | Registrations of companies (names, PIN of the president, activities, etc.) | Text | Municipality, regional tax office |
|
8.
|
Public Notary | Contracts, deeds, etc. | Text | Municipality, companies, citizens |
| Layers in 2D GIS | Real objects |
| General map reference | Grid, streets |
| Administrative units | Districts and suburbs |
| Parcels | Parcels and sub-parcels, public transportation, rightsof-way, public vending areas |
| Regulation plan | Project development boundaries |
| Buildings | Buildings, floors |
| Road-related paved areas | Paved street areas, parking places, pedestrian walkways, sidewalks |
| Street centrelines | Centrelines of street segments, delimited by intersection points |
| Project development plan | Project development outlines |
| Water distribution system | Water pipe segments, valves, hydrants, service tabs, service lines |
| Sanitary sewer system | Sewer pipe segments, manholes, valves, service taps, lateral lines |
| Electric distribution network | Primary and secondary above and under ground electric lines, poles, transformers, switches, fuses, substations, streetlights |
| Gas distribution system | Gas pipe segments, valves, service taps, service lines, cathodic protection device |
| Storm drainage system | Aboveground drainage channels, underground drainage lines, culvert openings, catch basins |
| Telephone network | Centrelines of telephone conductors, switching centres, poles, service lines, other point objects |
| Topography | Contour lines, height points |
The two groups with spatial extent, i.e. topographic and fictional delineate spatial objects. Whilst the topographic objects are primarily considered in the scope of 3D GIS, fictional objects are still not in a focus. The fictional objects are created to serve either global urban development (e.g. regulation plan, development plan) or environmental analysis (e.g. districts for monitoring pollution) or administration management (e.g. suburbs). Maintenance of fictional objects as objects in the 3D GIS-model might be relevant for monitoring urban processes and activities related to such objects, e.g. monitoring noise or air pollution.
The two groups that do not have geometric description (i.e. their spatial extend is not of interest), i.e. juridical and abstract, are to be regarded as non-spatial objects. The importance of non-spatial objects for a municipality is apparent. A variety of tasks might be based on the analysis of both spatial and non-spatial information, for example, the distribution of children of primary school ages to be able to plan the locations of new school constructions. In the currently used organisation of information, the names of the children and their addresses will be first obtained from a DBMS and then they will be localised in a GIS system on the basis of their address. In this respect, the maintenance of spatial and non-spatial objects in one information system will result in a significant facilitation.
The issue has another aspect. The non-spatial object does not have spatial extent, however, its status may change in a near future. Recent developments in computer graphics and virtual reality supply techniques to represent a human body (avatar) that moves in virtual worlds, speaks and interacts with other virtual persons. For example, an urban planner may participate in a virtual dispute represented by a personal avatar, which can be designed to bring significant messages, reveal characters and preferences objects (see Doyle et al 1998). Most of the chat-rooms on the Web already offer a library with images for personal identification. Similarly, abstract objects might be represented by media metaphor, e.g. virtual sheets stored in a drawer, etc. One can imagine that the design of geometric and physical properties (colour, material of paper) of historical documents will soon be attempted. That is to say that real objects represented and maintained as non-spatial objects might be transformed into spatial ones in the near future.
In this context, we advocate an integrated GIS capable of maintaining spatial and non-spatial objects. Moreover, 3D GIS should be able to maintain non-spatial objects with their relations, as well as interrelations with spatial objects. This thesis deals in detail with spatial objects, whereas non-spatial objects are considered at a conceptual level or, in exceptional cases, for the sake of completeness. More details can be found in Chapter 5.
Here, resolution refers to the smallest detail that has to be represented geometrically. Although familiar from 2D, the issue is more sophisticated in 3D and reflects the complexity of geometry. The third dimension poses questions about elements that are insignificant for 2D representations. For example, in 2D GIS the footprints (or roofs) represent buildings and no attention is paid to windows, doors, façade ornaments, etc. As a 3D representation, a building can be associated with a simple rectangular box, or with a composite of several boxes indicating windows, doors, etc. Either all the ornaments on a façade might be considered or only outlines of the wall. A tree might be constructed by several solid primitives, indicating thumb, leaves and branches or by a 3D symbol. Moreover, the criteria for resolution might be different for the different elements of the real object. For example, the ground floors of buildings in central areas (mostly shops) may be require higher resolution than the upper floors (mostly private apartments).
Most of the 3D city models constructed have very simple (low-resolution) geometric descriptions. The usual objects of 3D city models, i.e. buildings, are represented by their walls and roofs (Wizard Solutions, 1999). More rarely windows, doors, small balconies, levelled streets and pavements are reconstructed (a project of a telephone company, Arena 2000, 1999). Quite a lot of models are mapped with photo images (see Leberl and Gruber 1996). Detailed models including stairs, columns, rooms, furniture, etc., are designed only for individual buildings, e.g. Congress Centre, Graz, Music Centre, Enschede (see VRML worlds at the end of the Chapter 4). Fuchs 1996 reports high interest in roofs, as the size of the smallest element is critical for representing front details and overhanging elements. Floors are among the components where demand is very low. Internal constructive parts, e.g. rooms, corridors, are not investigated in the study of Fuchs. The resolution of the 3D city models is an indication of the resolution demanded in 3D. It should not be forgotten that 3D city models fulfil the requirements for exploration, training, guiding, and planning tasks, but not for analysis.
| Real objects | Resolution |
| Buildings | Basic: roof, wall, floors
Optional: doors, windows, façade ornaments (e.g. building with historical importance) |
| Bridges | Outlines, columns |
| Underground | Outlines |
| Streets | Road-bed, pedestrian areas, parking lots |
| Parcels | Outlines |
| Parks | Patches inside the park, significant trees |
| Vegetation | Trees |
| Water&sewer network | Segments, connections (inside, outside the buildings), outlines of rives and lakes |
| Electricity network | Segments, connections (inside outside, the buildings), traffic lights, lamp-posts |
| Telecommunications | Segments, connections (inside outside, the buildings), transmitters |
| Other man-made objects | Monuments, man-made holes |
| Districts | Boundaries of districts, grids |
| Terrain | - |
On the basis of the discussion above, real objects and their resolution are restricted in this thesis to the scope shown in Table 3-4.
From our experience, a systematised study on demand for 3D spatial relationships is not yet available. Therefore quite a lot of effort was spent clarifying the subject. The strategy followed with the questionnaire aimed to: 1) study the software used by the firms, in order to gain information about the type of relationships currently maintained, 2) detect the most frequent 2D analysis applied in daily work and 3) investigate spatial analysis that might be important for 3D. The software used by the firms is mostly 2D GIS with 3D extensions for visualisation (see Appendix 1, Table 1).
Table 2, Appendix 1 contains a summary of the results on 2D spatial analysis performed daily. As can be seen, priorities on metric, semantic and mixed analysis are given. Here, mixed analysis means query of spatial data composing a semantic condition, e.g. "show all the administrative building". The majority of the firms consider buffering analysis quite important as well. The results very much reflect the experience gained from the 2D analysis presently carried out in the offices, e.g. a frequent operation is the buffering of a railway.
Exploring the need for 3D spatial analysis appeared the most difficult task. Personal discussions revealed that firms found neighbourhood and network analysis important for 3D as well; however, they are still not aware of the benefits of 3D solutions. One argument is based on the preferences of non-GIS users (e.g. citizens) for paper maps with results rather than digital copies or screen displays. Another argument is the still quite high demand for digital 2D maps (about 50%). An analogue observation is reported in Fuchs 1996: 10% of producers and 10% of users operate only on digital 2D maps. We can summarise our observations concerning 3D analysis as follows:
The user has a strong tendency to think in 2 or 2.5D concerning spatial analysis. For example, a query "how many meters of pipes are necessary from the street to the 5th floor?" is modified to 1) "how many meters of pipes are necessary from the street to the footprint of the building?" and 2) "how many meters of pipes are necessary for five floors each 3.50 m high?".
| Buildings | Bridges | Under
Ground |
Streets | Parcels | Parks | Utilities | Others | Vegetation | Districts | Terrain | |
| Buildings | y | y | y | y | y | y | y | - | - | 3 | - |
| Bridges | y | y | - | y | y | y | - | - | - | y | - |
| Underground | y | - | y | y | y | y | - | - | - | y | - |
| Streets | y | y | y | y | y | y | y | y | y | y | - |
| Parcels | y | y | y | y | y | y | y | y | y | y | - |
| Parks | y | y | y | y | y | y | y | y | y | y | - |
| Utilities | y | - | - | y | y | y | y | - | - | y | - |
| Others | - | - | - | y | y | y | - | - | y | y | - |
| Vegetation | - | - | - | y | y | y | - | y | - | y | - |
| Districts | y | y | y | y | y | y | y | y | y | y | - |
| Terrain | - | - | - | - | - | - | - | - | - | - | - |
The list of relationships does not pretend to be comprehensive, e.g. duplicated relationships (wall contains window) are not mentioned. Chapter 6 elaborates and formalises the spatial relationships (adjacent, inside, outside, under, over, part of, contain) obtained.
Metric (i.e. line, area, volume computations), proximity (i.e. buffering), visibility (i.e. line of sight) and network (i.e. routing to particular object) analysis are deliberated only partially in respect to means and techniques for visualisation, i.e. the development of exhaustive algorithms is outside the scope of the thesis.
Chapter 2 has discussed the importance of the realism for the perception and orientation in 3D models. The term realism is intuitively associated with techniques for visualisation, however, it is related to the resolution and the representation of physical properties (roof material, colour of façades, street surfaces, etc.) of real objects. Thus, the required realism can be achieved either by very high resolution and/or a higher similarity between real and modelled physical properties. An increase in resolution to improve the realism is apparently the more expensive and hence less acceptable solution. The research gives preference to resolution determinated on the basis of application needs and a realism obtained on the basis of a realistic representation of physical properties. Thus the issue becomes significant for the thesis with respect to parameters necessary to ensure the demanded level of realism. For example, if the GIS users prefer shaded models, parameters to indicate the colour of surfaces are sufficient.
Chapter 2 presented the tendency in CG to utilise artificial and real images for texturing instead of comprehensive methods for illumination and shading. Relying on technology availability, the users were stimulated to think in terms of utilisation of images to "wrap" the surface of the objects. Many authors (see Pilouk 1996, Tempfli 1998a, Gruber et al 1995) have argued that urban models can benefit from photo texturing in several directions: 1) representations of details without geometric modelling, 2) improvements in the orientation while interacting with the model, 3) facilitation of user perception of sizes and shapes. Therefore, the users were asked to consider real photos and artificial images to wrap and map the geometry. Our study on texture needs exhibited high percentages in support of photo texturing (seeAppendix 1, Table 5). Even those who prefer 2D visualisation and/or 3D wire frame visualisation found only photo texturing meaningful.
Apart from the pursued realism, most of the methods for visualisation that are mentioned in Chapter 2 are considered quite suitable to display objects, emphasise important object characteristics, control and edit geometric representations:
3.3 GUI, interaction and operations
The last item in our investigations attempted to determine some aspects related to GUI: mostly manipulated spatial data and the necessity for remote access to data. The first aspect provides information about the objects that have to be accessible for manipulation and thus it influences the geometric representation of data (see Chapter 4). The second aspect is related to the system architecture for assessing and visualising data. Analysis of the customers of the municipality, as well as the results of the questionnaires, clarified a critical aspect of the issue: the pursued interaction is in close correlation with the daily activities of the institution (firm, company or organisation) according to the classification given in Table 3-1. An organisation dealing with data acquisition and the frequent update of data, i.e. GIS producers demand extended means to operate on smallest constructive element (e.g. point, line and polygon) of an object. All the participants in the interview belong to the group of producers. Table 6 (see Appendix 1) illustrates the most updated elements and, respectively, the strong preference to wire frame graphics. VR modellers are not mentioned by any of the firms (see Appendix 1, Table 5), which could be an explanation for the higher interest in wire frame. Moreover, producers prefer a stand-alone or Intranet realisation of 3D GIS without a direct connection to other companies. The motivation refers to specific problems relating to the higher speed of interaction with the models and the manner of supplying outputs (i.e. end-product) to customers.
| Potential users of a GIS | Potential users of a GIS | ||
| Local users | Remote users | ||
|
1.
|
Municipal Offices and Departments: |
1.
|
Water and Sewerage Corporation |
| - Department of Administration and Information Services |
2.
|
Electricity Company | |
| - Municipal Land Commission |
3.
|
Telecommunication Company | |
| - Municipal Cadastre and Regulation Department |
4.
|
Invest Engineering | |
| - Department of Architecture |
5.
|
Police | |
| - Department of Construction |
6.
|
Civil Security | |
| - Department of Economics |
7.
|
Regional Tax Office | |
| - Financial Department |
8.
|
Information Services Ltd. | |
| - Department of Social Services |
9.
|
State Archive | |
| - Department of State and Municipal Properties |
10.
|
Public Notary | |
| - Transport and Traffic Safety |
11.
|
Banks | |
| - Regional Cadastre and Survey Office |
12.
|
Other companies, agencies, offices | |
| - Regional Land and Land Use Office |
13.
|
Citizens |
The municipality information system serves internal and external users and in this context the municipality is an information centre. On another hand, the municipality governing body is an operand of the information system and hence the municipality is a consumer. However, the municipality certainly does not act as a producer of data. Consequently, vast editing and updating operations such as among producers (Appendix 1, Table 6) are rarely observed. Instead, visualisation and modifications of individual objects or parts of objects can be expected quite often. For example, discussions on the renovation of a neighbourhood may result in a slight shift in streets or buildings. At this stage, the construction plans are either already approved or not yet available. Hence, the level of editing provided by CAD products (i.e. access to points and polygons) is not required. The process of municipality governing is less interactive than the process of factual design of buildings, streets, etc. Although the urban planners participate in the design, their tasks have a more global scope than the tasks of architectures. For example, de Vries et al 1997 classify the design techniques applied in architectural modelling into: sketching, drawing, simulation and managing. Sketching is related to conceptual design when no explicit shape is required, the drawing stage refines the geometry, simulation introduces behaviour (thermal, structural, human) and managing refers to the manipulation of data flows (scheduling of the building process). Access to basic constructive primitives is required only for drawing, while for sketching even the primitives can vary. Whilst sketching and drawing are techniques outside global planning interests, simulation and managing may involve environmental impact considerations. These design techniques, however, need means to operate on objects rather than on constructive elements.
The municipality usually has contacts with a variety of users from different organisations (see Table 3-6), which are equipped with different hardware platforms and software. The common way of exchanging data is digital or paper copies (e-mailed or post-mailed) of needed information. To shorten this process, i.e. save time, effort and money, the municipality has to be able to offer a basic set of operations and data to all organisations needing their service. For example, the members of a telephone company have to be able to check on-line the owners of buildings or ask for statistics about suburbs that are not available in the company in any time during the discussion on a new project. Many of the municipality consumers are regular citizens asking information. Although, hard-copy outcomes will still be popular for quite long time (see Table 3-7), the importance of on-line services increases every day. The day is coming when computer corners for self-service will replace counters in the municipality. Hence, the municipality has to be capable of supplying information to remote and local users. In this respect, utilisation of the Web is an alternative that ensures flexibility (variety of data formats), accessibility (no location restrictions) and hardware independence (wide availability of Web browsers) of the GIS. Accordingly, the municipality system has to be prepared for a wide range of users with diverse backgrounds. This imposes also GUI and security requirements. The interface has to be user-friendly, flexible enough to cover a large spectrum of questions (in both semantic and geometric domains), and to offer sufficient tools for understanding the results and exploration of the model. The system must have reliable security protection against crackers or unintentional mistakes.
Table 3-7: Operations and outcomes
| Activity | Operations | Outcome |
| Urban planning | Query and display of parcels, buildings, streets, etc., as a result of spatial and semantic queries, display and editing of new projects for buildings, streets, etc. | Screen display: graphics and text
Hard copy: maps |
| Parks layout | Display and editing current situation and new projects | Screen: graphics |
| Utility maintenance | Query and display of activities for maintenance | Hard copy: maps |
| Property evaluation | Query and display of properties, calculation of property values | Screen: graphics and text
Hard copy: text |
| Demographic and statistic analysis | Queries on specific attributes (people: age, education, occupation; buildings: age, construction, floors, etc.) | Screen display: text
Hard copy: reports and maps |
| Citizens' service | Query and display of parcels and buildings | Screen: graphics and text
Hard copy: graphics and text |
The thesis concentrates on the issues discussed above with some simplifications and limitations:
Operations: Table 3-7 gives the most important operations and standard outputs in the investigated municipality. Query and display of information are prevalent operations for many activities, as the displayed data can be either text or graphics. For the thesis, this fact implies that means for pointing, formulating queries and visualising of text and 3D graphics has to be ensured.
Interaction: Chapter 2 presented a broad view of the levels of interaction, as the advantages of VR techniques for exploration were discussed. Among the different techniques mentioned, the entry level will be tested for a municipality 3D GIS for a number of reasons:
3.4 User requirements for a municipal 3D GIS
The study of a municipality organisation, questionnaires among firms producing spatial information and the world-wide experience in building 3D city models have made it possible to clarify important aspects of user demands relevant for the scope of this thesis. A municipal 3D GIS has to be able to:
The chapter presents a commentary on user requirements for a municipal 3D GIS as the scope of objects, their geometric details and spatial relationships important for the thesis are delineated. The subject is very difficult to investigate due to a number of reasons: the high production cost of 3D models and therefore little experience; the lack of functional 3D GIS, a lot of information kept in 2D GISs (spatial analysis traditionally completed in 2D), large amounts of data and complex visualisation (needs of conceptually new software).
The questionnaires among several production companies with urban specialisation provided valuable information on the importance of real objects, demand for spatial analysis and required resolution. Questions related to preference for 3D visualisation helped in clarifying some aspects of realism of urban models and needed operations. A study on the processes and tasks of a municipality specified the scope, distribution and responsibilities for information, basic functions, current and potential partners and customers, present format of outcomes, etc.
Considering the items of interest, a subset of the most important objects (which will be considered in the thesis) is outlined. Two important aspects related to municipal data and tasks were observed: 1) often interrelations between spatial and non-spatial objects are needed, and 2) specific spatial objects without physical appearance in the real world are currently maintained. To distinguish between the objects, a classification regarding the spatial extent, which distributes the objects into four groups, is introduced. Besides the group of topographic objects, a second group with spatial extent, i.e. fictional, is formed. Thus the content of 3D GIS for a municipality is extended to comprise spatial and non-spatial objects. The scope of spatial objects is extended to comprise fictional objects, taking into account their importance for municipality governance. The following chapters will consider all the groups, but with some exceptions.
The investigations gained knowledge of required GUI and outputs. The users agreed on the significance of shading and photo texturing methods for 3D modelling. Thus, the organisation of image files for texturing becomes an essential issue for the GIS model. Texture draping, shading and wire frame graphics are to be used as supplementary techniques to speed up visualisation and improve understanding of the 3D scene.
Several essential conclusions were made on the basis of
a specific characteristic of a municipality, i.e. diverse customers having
different experiences with GIS data and located in local and remote offices.
The visualisation and exploration of outcomes, powered by virtual reality
techniques (fly-over, examine, walk-through), will
facilitate access to the objects in the scene, speed up exploration of
the model and improve readability of the results. The utilisation of Web
techniques to access data may fast become a solution for a remote, standardised
access.